Fluctus @ OSTST 2019
(October 2019) Fluctus has participated to the 2019 Ocean Surface Topography Meeting at Chicago.
Bruno Picard has given 2 talks and collaborated to 1 poster.
First talk (download the slides) is dedicated to the first results of the AMTROC study funded by Eumetsat and performed by Informus and Fluctus. The goal is to define, develop and assess a 1DVAR retrieval of the Wet Tropospheric Correction for Sentinel-3 altimetry missions. This talk was given on behalf of Ralf Bennartz who is the main author.
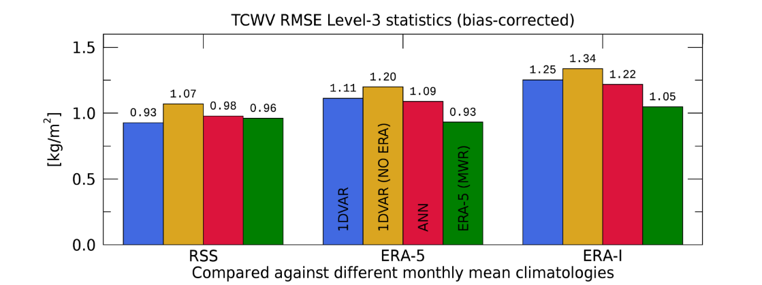
Credits: Ralf Bennartz
Second talk (download the slides) is about the impact of rain on the wave scatterometer SWIM on-board the CFOSAT mission. The study is funded by CNES. This talk results from a teamwork gathering the mission leaders from CNES, microwave experts from CLS, scatterometer/wave experts from IFREMER and Fluctus. The objective is to assess the impact of rain on the SWIM observation and to propose metrics to detect rain conditions.
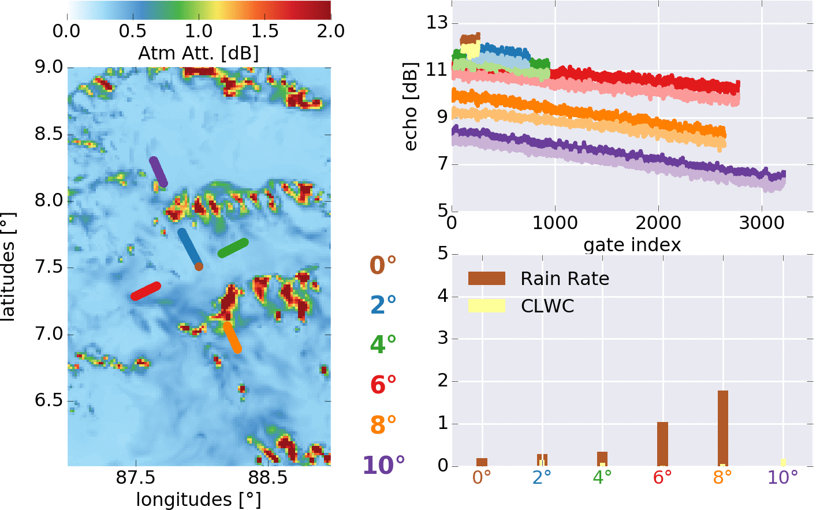
Credits: CLS/Fluctus
Poster (download the poster) presents the first results on an analysis of the wet tropospheric correction short spatial scales variations. The study is funded by CNES and is performed by CLS (Marie-Laure Frery) and Fluctus. The objective is to assess the variability of the wet tropospheric correction for spatial scales below 50 km. This is performed using two different approaches. The first part analyzes the differences between the WTC estimated by Jason-1 and Jason-2. During the geodesic period of Jason-1, the orbit is drifting so the distance between the tracks of the two instruments varying from a few kilometers up to several hundreds. The second part looked at the difference between the WTC computed from pairs of GPS stations.
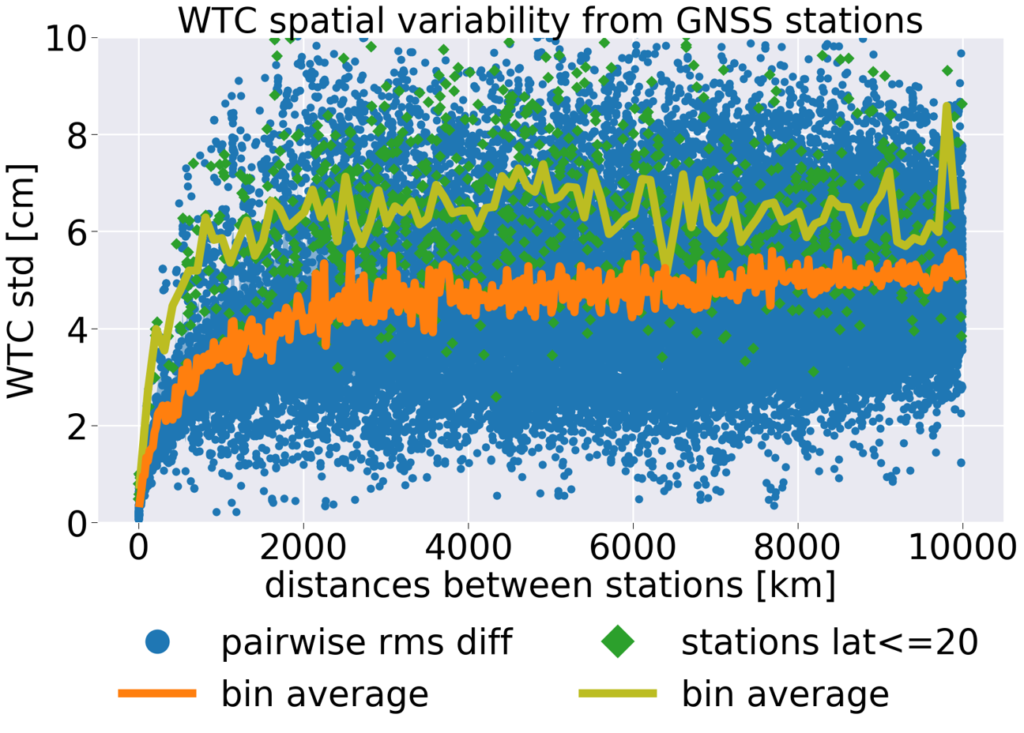
Credits: Fluctus
Recent Comments